Currently Empty: $0.00
How To Create Infographics With Canva: A Beginner’s Guide
Introduction:
Want to capture your audience’s attention with stunning visual content but don’t know where to start? Infographics are an incredibly effective way to convey complex information quickly and engagingly. Whether you’re a marketer, educator, or business owner, knowing how to create infographics with Canva can dramatically enhance your content strategy.
Many beginners feel overwhelmed by the thought of designing infographics, believing it requires advanced graphic design skills or expensive software. Without proper guidance, it’s easy to feel lost in the process of making visually appealing and informative graphics. This can lead to frustration and missed opportunities to effectively communicate your message.
The good news is that you don’t need to be a design expert to create impactful infographics! This beginner’s guide will show you exactly how to create infographics with Canva—a user-friendly tool that simplifies the design process. You’ll learn step-by-step how to use Canva’s features to craft eye-catching infographics that effectively communicate your ideas and engage your audience.
What are Infographics?
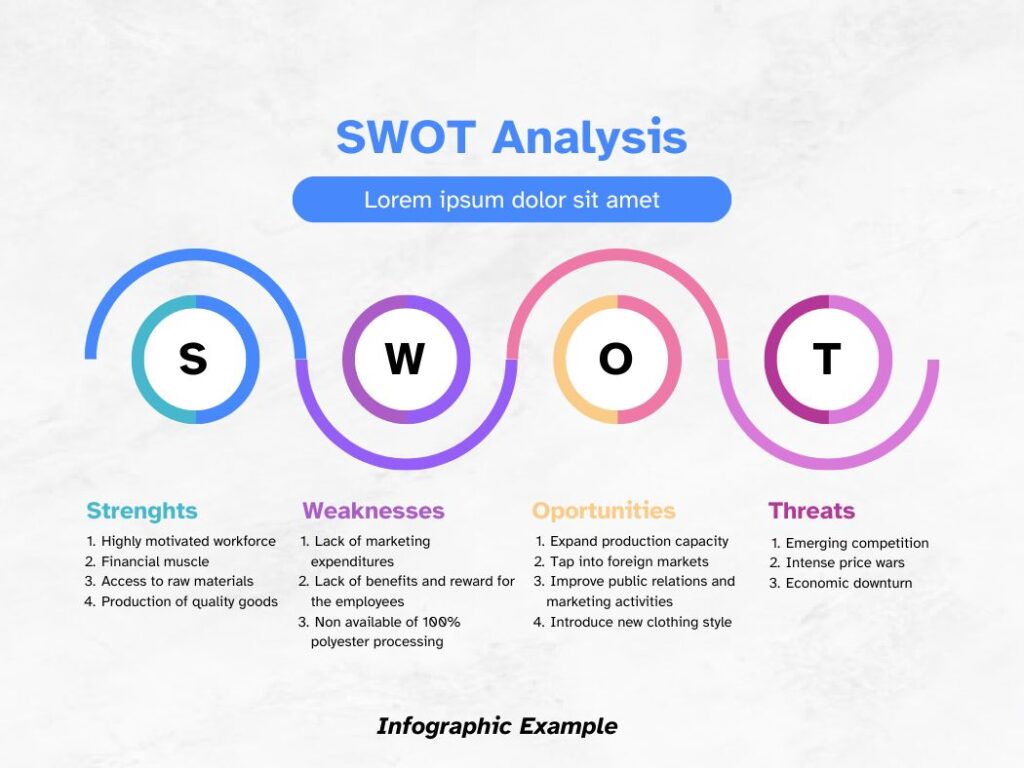
Infographics are a fantastic way to present complex information in a visually appealing and easily digestible format. They are widely used across various industries to communicate data, statistics, and insights in a concise and engaging manner. However, creating infographics can be a daunting task, especially for those without extensive design experience. In this blog post, we will explore how to create infographics using Canva, a powerful and user-friendly design tool.
Why Infographics?
Infographics are an effective way to communicate information because they combine text and images in a way that is easy to understand and visually appealing. They are particularly useful for presenting data, statistics, and insights in a concise and engaging manner. Infographics can be used to:
- Communicate complex information: Infographics are ideal for presenting complex information in a simple and easy-to-understand format.
- Enhance blog posts: Infographics can be used to enhance blog posts by providing a visual representation of the information being presented.
- Increase engagement: Infographics are highly engaging and can help increase audience participation and interaction.
- Improve brand recognition: Infographics can be used to create a consistent visual brand identity and enhance brand recognition.
Key Characteristics of Infographics
- Visual Representation: Infographics use visual elements such as images, charts, graphs, and icons to convey information. This makes it easier for the viewer to understand and retain the information.
- Data-Driven: Infographics are often based on data or statistics, which are used to create the visual representation.
- Simple and Concise: Infographics aim to present complex information in a simple and concise manner, making it easy for the viewer to understand.
- Interactive: Infographics can be interactive, allowing the viewer to explore the information in more detail.
- Customizable: Infographics can be customized to fit the specific needs of the project or audience.
Types of Infographics
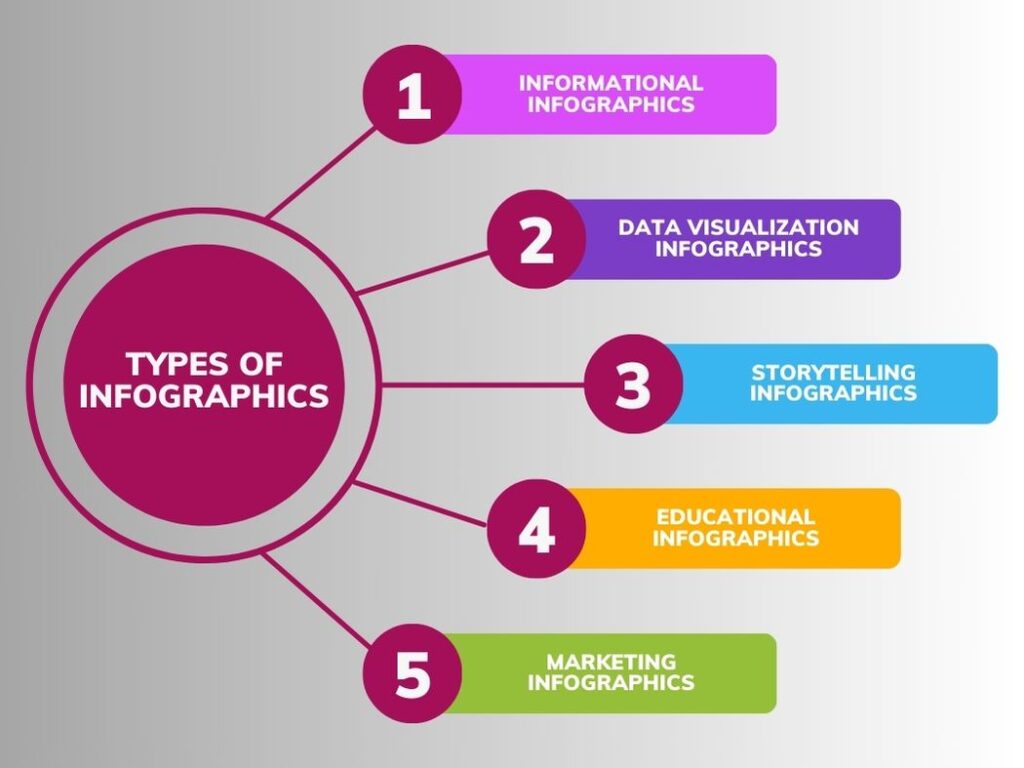
- Informational Infographics: These infographics provide information on a specific topic or subject, such as a tutorial or a fact sheet.
- Data Visualization Infographics: These infographics use data to create visual representations, such as charts, graphs, and maps.
- Storytelling Infographics: These infographics use visual elements to tell a story or convey a message.
- Educational Infographics: These infographics are designed to educate or inform the viewer about a specific topic or subject.
- Marketing Infographics: These infographics are used to promote a product, service, or brand.
Benefits of Infographics
- Improved Understanding: Infographics can help viewers understand complex information more easily.
- Increased Engagement: Infographics can be interactive, making them more engaging for the viewer.
- Enhanced Communication: Infographics can be used to communicate complex information in a simple and concise manner.
- Increased Shareability: Infographics are often shared on social media and other platforms, increasing their reach and impact.
- Cost-Effective: Infographics can be created at a lower cost than other forms of communication, such as videos or print materials.
How to Create Infographics with Canva?
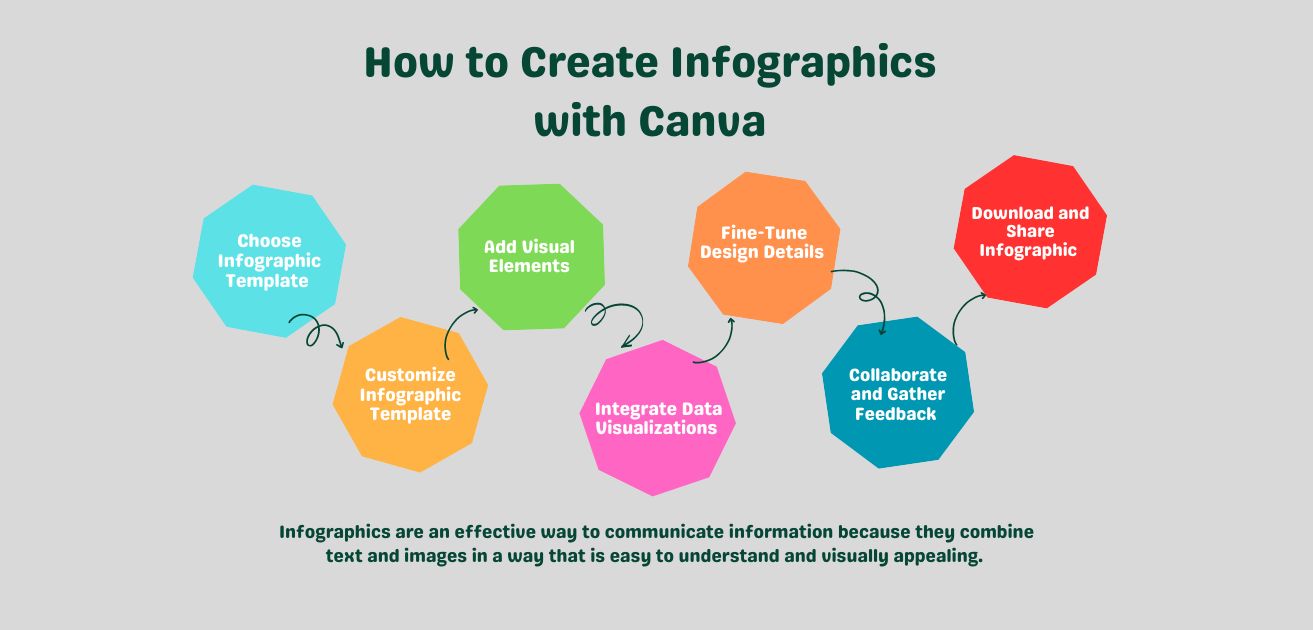
Here is a step-by-step guide for creating stunning infographics with Canva:
Step 1: Access Canva and Choose Infographic Template
- Visit Canva’s website and sign in to your account or create a new one.
- Once logged in, navigate to the search bar and type “infographic.”
- Browse through the selection of infographic templates and choose one that suits your content and style preferences.
Step 2: Customize Infographic Template
- Click on the chosen template to open it in the Canva editor.
- Replace placeholder text with your own content by clicking on the text boxes and typing or pasting your text.
- Customize fonts, font sizes, and text colors to match your branding or design preferences.
- Add or remove sections as needed by duplicating or deleting elements within the template.
- Incorporate your branding elements such as logos, colors, and fonts to maintain consistency across your infographics.
Step 3: Add Visual Elements
- Spice up your infographic with relevant visuals such as icons, illustrations, and images.
- Click on the “Elements” tab in the sidebar and use the search bar to find suitable graphics.
- Drag and drop graphics onto your infographic canvas and resize them to fit your design.
- Arrange visual elements strategically to enhance readability and visual appeal.
Step 4: Integrate Data Visualizations
- If your infographic includes data, use Canva’s chart and graph tools to visualize it effectively.
- Click on the “Charts” tab in the sidebar and select a chart type that best represents your data (e.g., bar chart, pie chart, line graph).
- Input your data into the chart tool and customize the appearance, labels, and colors to match your infographic’s style.
- Place the data visualization within your infographic layout, ensuring it complements the overall design.
Step 5: Fine-Tune Design Details
- Review your infographic for coherence, alignment, and consistency.
- Adjust spacing, alignment, and visual hierarchy to improve readability and flow.
- Experiment with different color schemes and backgrounds to find the most visually appealing combination.
- Double-check spelling and grammar to ensure accuracy and professionalism.
Step 6: Collaborate and Gather Feedback
- Share your infographic with collaborators or colleagues for feedback and suggestions.
- Use Canva’s collaboration features to invite others to view or edit your design in real-time.
- Incorporate feedback to refine your infographic and make necessary adjustments.
Step 7: Download and Share Infographic
- Once satisfied with your design, click on the download button in the top right corner of the Canva editor.
- Choose your preferred file format (e.g., PNG, JPG, PDF) and resolution.
- Share your infographic across various platforms such as social media, blogs, presentations, or websites to reach your target audience.
By following these steps and using Canva’s intuitive design tools, you can create stunning infographics even if you have no prior design experience. Canva’s wide selection of templates and customization options make it easy to design visually compelling infographics to engage your audience.
Tips and Tricks to Create Infographics with Canva
Here are some tips and tricks to help you create infographics with Canva:
- Keep it simple: Keep your infographic simple and easy to understand. Avoid clutter and focus on the most important information.
- Use visuals: Use visuals such as images, charts, and graphs to make your infographic more engaging and easy to understand.
- Use color effectively: Use color effectively to draw attention to important information and to create a visually appealing infographic.
- Use typography effectively: Use typography effectively to create a clear and easy-to-read infographic.
- Keep it concise: Keep your infographic concise and to the point. Avoid including too much information and focus on the most important details.





Comments are closed.